Bitcoin (BTC) Price Analysis for August 2
Bears are not going to give up so easily, according to the CoinMarketCap ranking.
Top coins by CoinMarketCap
BTC/USD
Bitcoin (BTC) is one of the biggest gainers today as its rate has risen by almost 2%.
Image by TradingView
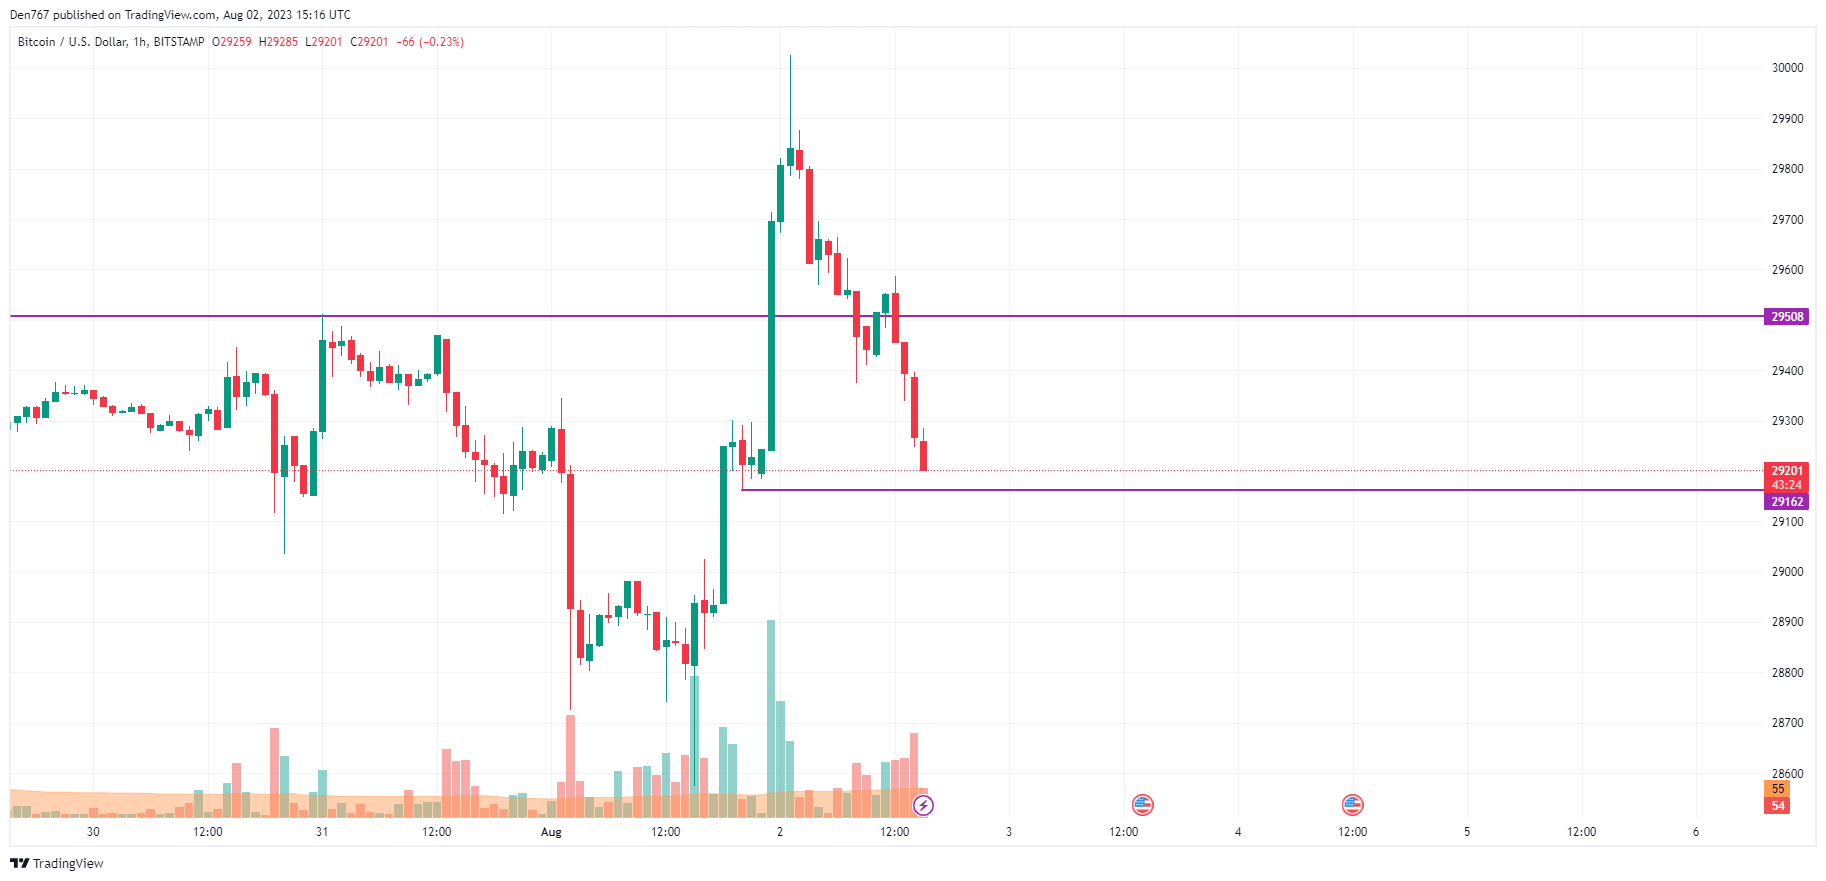
Despite the fall, the rate of Bitcoin (BTC) is bearish on the local chart as the price is about to test the recently formed support at $29,162. If the bar closes below that mark, the decline may continue to the $29,000 zone soon.
Image by TradingView
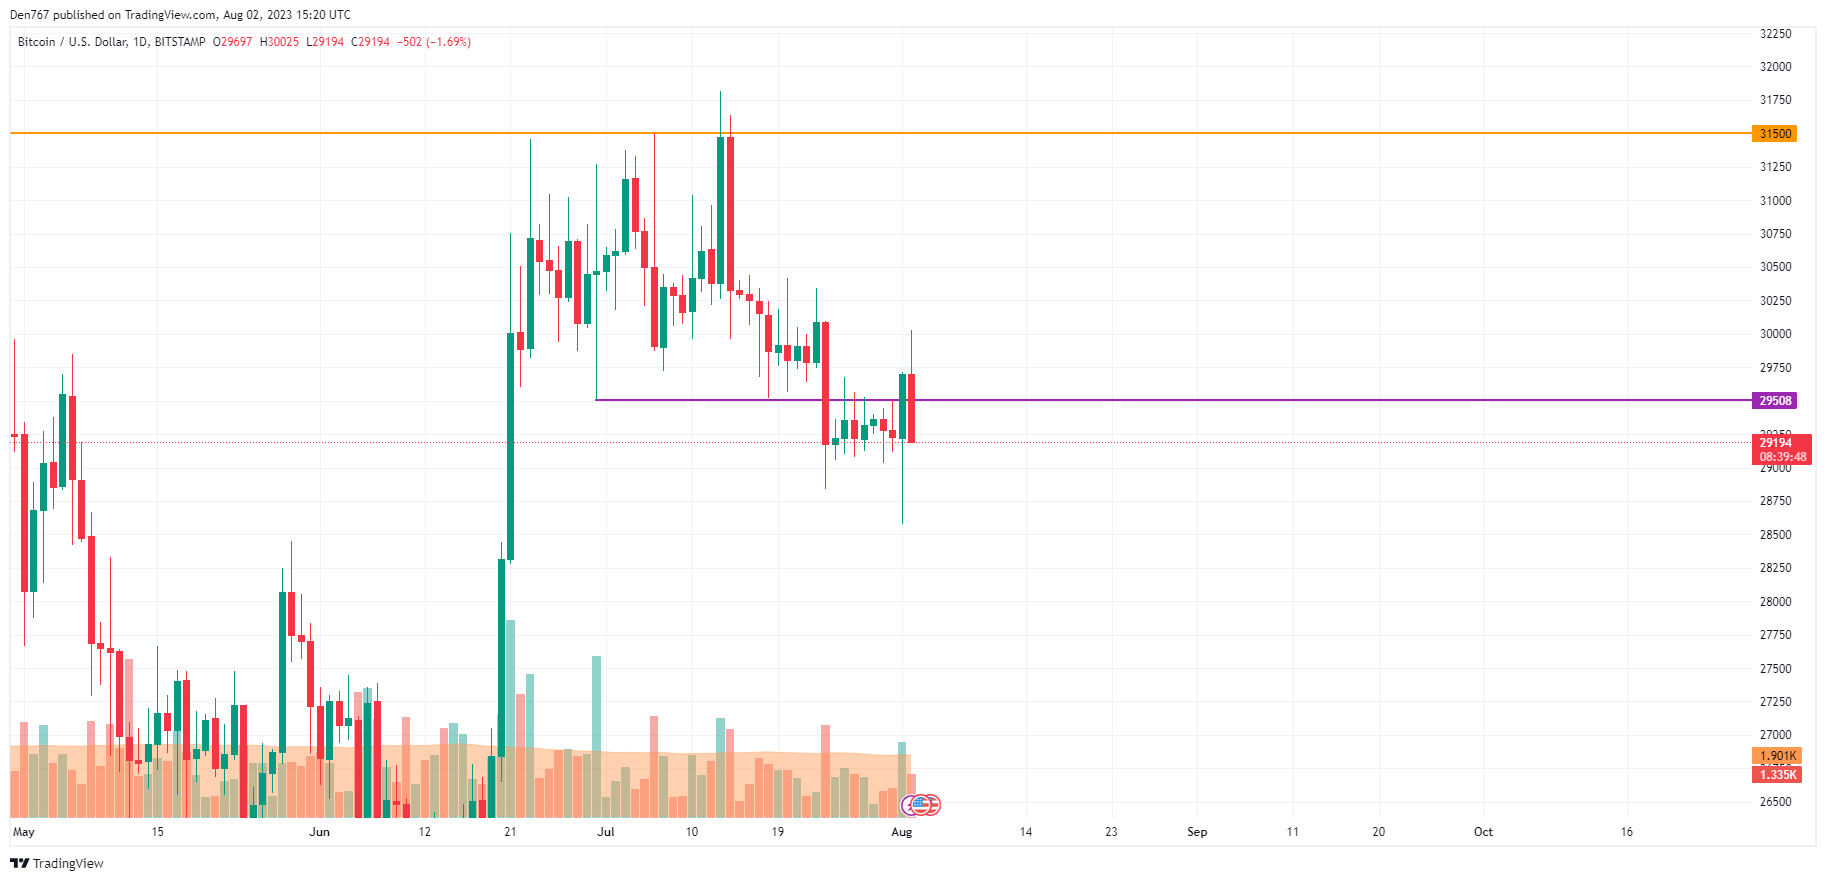
On the daily time frame, the price of Bitcoin (BTC) has failed to fix above the level of $29,508, which means that sellers remain more powerful than buyers. In this regard, the more likely scenario is the ongoing correction to the $28,500 range.
Image by TradingView
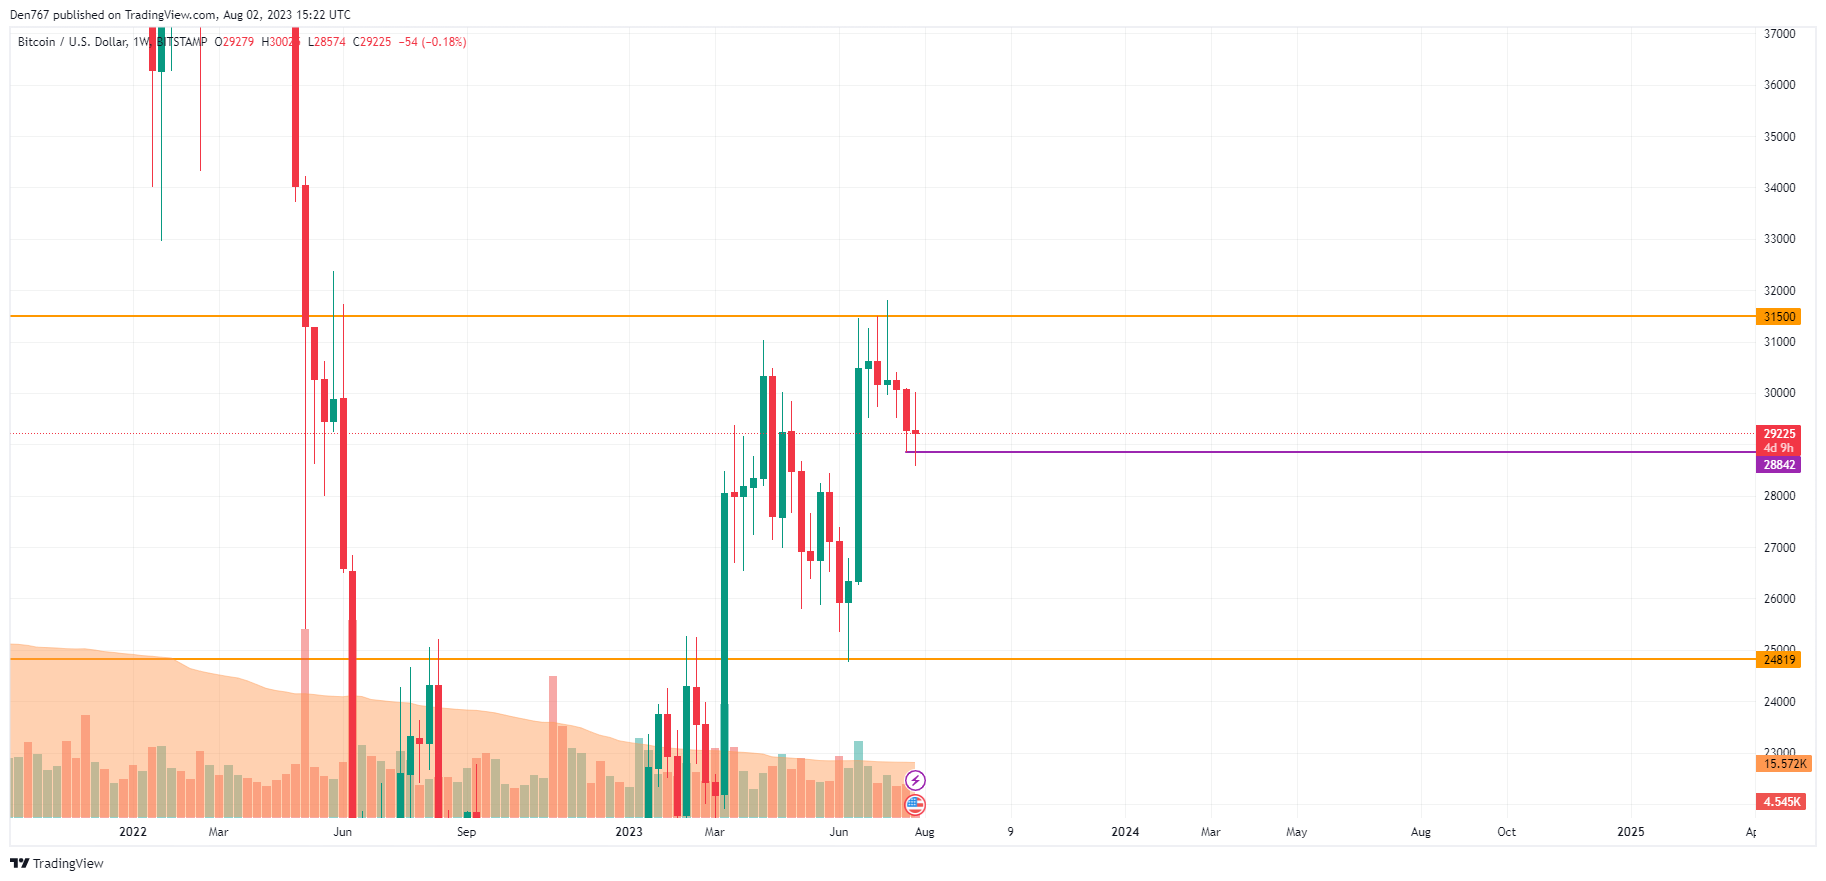
From the midterm point of view, traders should focus on the previous candle low at $28,842. If the closure happens far from it, buyers may seize the initiative, which can lead to a rise to $30,000.
Such a scenario is relevant until mid-August.
Bitcoin is trading at $29,255 at press time.


.jpg?w=390&resize=390,205&ssl=1)


